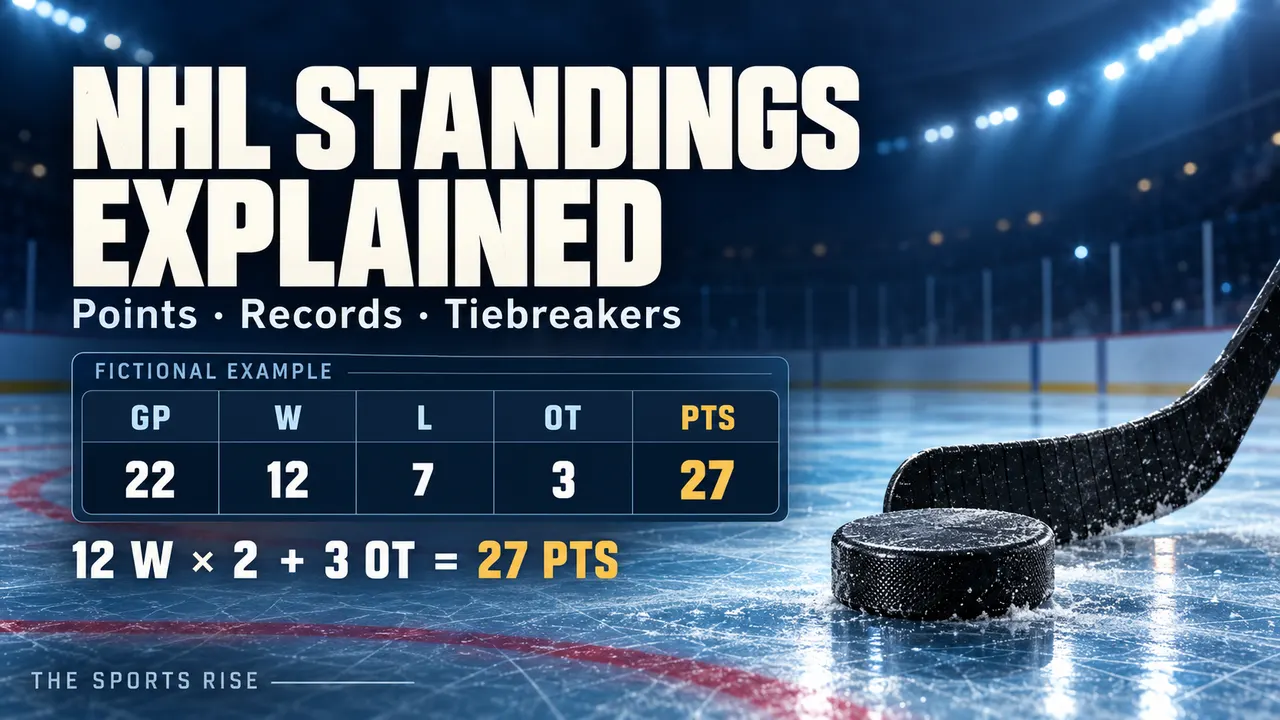
NHL standings are easier to read when you separate three questions: how many points has a team earned, how many games has it used, and how were its wins achieved? Start with the points total. Then check games played before reaching for a tiebreaker.
For a standard regular-season record, PTS = (2 × W) + OT/OTL: two points for a win, one for an ordinary overtime/shootout loss, none for a regulation loss. There is an extra-attacker exception worth knowing, explained below. This guide uses the NHL's 2026–27 rulebook, with fictional examples rather than live team rankings.
Read the columns before comparing teams
| Column | Meaning |
|---|---|
| GP | Games played |
| W | All wins, including overtime and shootouts |
| L | Zero-point losses in the regular-season record |
| OT or OTL | Overtime/shootout-loss category |
| PTS | Standings points earned |
| RW | Regulation wins |
| ROW | Regulation plus overtime wins; shootouts excluded |
| P% | Points earned divided by points available |
RW, ROW and W describe overlapping groups, not three piles to add together. RW ≤ ROW ≤ W. The NHL glossary sets out these win categories and the official tiebreaking sequence.
Try a simple audit before interpreting a table: add W, L and OT/OTL. They should account for GP in the standard record. If your arithmetic does not match, check the column headings and official game record before deciding the table is wrong. A goaltender's personal record is a different table; do not substitute it for the club's standings row.
Work through a fictional 12–7–3 record
Suppose the imaginary North club has 12 wins, seven zero-point losses and three ordinary overtime/shootout losses. No extra-attacker forfeiture applies in this example.
| Check | Calculation | Answer |
|---|---|---|
| Games used | 12 + 7 + 3 | 22 GP |
| Points from wins | 12 × 2 | 24 |
| Points from OT/OTL | 3 × 1 | 3 |
| Total | 24 + 3 | 27 PTS |
| Points available | 22 × 2 | 44 |
| Points percentage | 27 ÷ 44 × 100 | 61.36% |
North has failed to win ten games, not seven: the final three results still describe defeats. Their separate column changes the points calculation; it does not turn them into victories.
Now give North one more ordinary result. A win makes the record 13–7–3 and the total 29 points. A regulation loss produces 12–8–3 with 27. An ordinary overtime loss produces 12–7–4 with 28. Checking the updated row this way helps you see what the result actually added.
P% also helps you compare different amounts of hockey. Imagine one club has 28 points from 24 games and another has 26 from 20. Their percentages are 58.33% and 65%, respectively. The first has more points banked; the second has collected a larger share of its available points. That comparison describes pace, not an instruction to replace the NHL's official ranking or predict the remaining results.
Why fewer wins can still leave a team ahead
These two clubs and every number in this table are hypothetical.
| Club | GP | W | L | OT/OTL | PTS | RW | ROW |
|---|---|---|---|---|---|---|---|
| River | 10 | 4 | 4 | 2 | 10 | 3 | 4 |
| Harbor | 10 | 5 | 5 | 0 | 10 | 2 | 4 |
River's points calculation is 4 × 2 + 2 = 10. Harbor's is 5 × 2 + 0 = 10. Games played are equal, so that first comparison cannot separate them. River then leads on RW, three to two, despite having fewer total wins. The comparison ends there; Harbor cannot skip ahead to W because it prefers that column.
The same numbers also show how to unpack a record. River's four ROW include its three regulation wins, leaving one overtime win. Harbor's four ROW include two regulation wins and two overtime wins. Its fifth total win therefore came in a shootout. Those deductions work because the categories are nested.
Apply the tiebreakers in order
For tied regular-season points, the sequence is: fewer GP; more RW; more ROW; more W; the applicable head-to-head points comparison; better goal differential; then more goals for. The head-to-head test has odd-game exclusions and a percentage calculation for multi-team ties. Use the full official procedure for those cases.
Do not treat this as seven simultaneous votes. Move down only while the teams remain tied. In the fictional River–Harbor comparison, calculating goal differential would add work without changing the answer. For a real close race, read the official ordering alongside the actual standings rather than relying on a cropped screenshot missing GP or RW.
The overtime exception and two different meanings of points
Under Rule 84.2, a club that removes its goalkeeper for an extra attacker during regular-season overtime forfeits the automatic point if it loses while the goalkeeper is removed. Removal for a delayed penalty against the opponent is the stated exception. Check the official result instead of automatically awarding every overtime defeat one point.
Standings points belong to the club. A player's scoring points count goals and assists under Rules 78.2–78.3. Those numbers answer different questions and should never share a calculation.
Playoff progress is decided by series wins, not by adding regular-season standings points. For the on-ice differences, use our first NHL game viewing guide.
A dated example from the NHL
The NHL's 14 May 2021 post announcing Colorado's Presidents' Trophy is historical context, not today's standings or a playoff forecast. Keep that date attached when viewing the embedded post.
Historical NHL post: 2020–21 Presidents’ Trophy
Post by NHL (@NHL) · Source checked
Article context: Historical post dated 14 May 2021. It illustrates an NHL regular-season trophy announcement; it is not current standings or a 2026 playoff forecast.
This post loads automatically and connects to X, which can process your browser data. X privacy policy. The article context and source link remain available if the post is removed or cannot load. Video playback stays under your control.
X post will load automatically when this page is ready.
Use the fictional tables above to practise, then open the official standings and identify GP, PTS and RW for two clubs. Return to our NHL coverage for related stories.
Featured illustration: original AI-assisted educational artwork by The Sports Rise. The standings row is fictional and matches the worked example; it does not show live NHL rankings.